Developer Debug Menu
Contents
- 1 Keyboard Shortcuts
- 2 Debug Menu
- 3 Debug Texts
- 4 Map
- 4.1 Auto Reload Resources
- 4.2 Reload Script At Task Switch
- 4.3 Reload Script Constantly
- 4.4 Recompile Script and Lang
- 4.5 Reload from current pos
- 4.6 Fast Physics Load
- 4.7 Reload Game
- 4.8 Script Debug
- 4.9 Teleport to Start Pos
- 4.10 Load Map
- 4.11 Test Change Map Save
- 4.12 Preload Map
- 4.13 Start Preloaded Map
- 4.14 Keep Previous Map Loaded
- 4.15 Preload Priority
- 5 Game
- 6 Input
- 7 Stress Test
- 8 Misc
- 9 Graphics Debug
When developing your mod, it is important to be able to have a fast feedback loop and have extensive set of tools which can help to test our mod. Exactly for that reason, we have the Developer Menu. This article goes in detail over the menu and all of its features.
Keyboard Shortcuts
The following keyboard shortcuts are enabled during dev mode:
| Shortcut Key | Action |
|---|---|
| F1 | Brings up the developer debug menu. This needs to be done in order to have full access to the developer features when running a game in debug mode. |
| F2 | Pauses / Resumes the game world processes, basically makes the game freeze. Note that you can still noclip in this state. |
| F3 | This makes the game run 4 times faster. It is good if you want to skip specific sections in the map. |
| F4 | This makes the game run 4 times slower. It is good if you want to want to focus on something that happens very fast in the map. |
| F5 | Reloads the current map. |
| F7 | Enables / Disables spectator camera mode (noclip). |
| F8 | Takes a screenshot of the game and saves it inside the main game folder. |
| F9 | Quick-saves the game. |
| F10 | Quick-loads the last save. |
| Insert | Starts / Stops quick input recording and saves to the file QuickRecord.sav. |
| Home | Starts playing back the last quick input recorded file. |
Debug Menu
The debug menu is where most of the work happens. There, you can find a list of useful actions which will help you in your mod development.
ᅠ
Debug Texts
This section is at the very top of the menu and consists of checkboxes which display different information about the game, map, physics, script, etc on in the form of text on the screen.
Texts Options
| Option | Description |
|---|---|
| Show FPS | Shows the game FPS. |
| Show module info | Shows information about different user modules. It does not seem to be useful however, as not enough information is displayed. |
| Show map info | Shows the amount of entities in the map and their state. |
| Show entity info | Does not work. |
| Show sounds playing | Shows a list of all the sounds that currently play in the map, and information about them. |
| Show sound params | Adds additional information to the sounds playing list (distance from player) |
| Show sound categories | Shows a list of all the different sound level categories. |
| Show sound ai event | Shows a message when an Ai agent has heard a sound. |
| Show debug messages | Shows dev messages which are specified in the map script file. |
| Show event/voice messages | Does not work. |
| Inspection Mode | Enables inspection mode, which displays information about assets used in the map, such as texture files, location on disk, size, etc. |
| Occlusion Culling | Enables occlusion culling (Skips rendering polygons that are no in the view of the player ). |
| God Mode | Makes the player invincible and prevents from getting chased by enemies. |
| Draw physics debug | Displays physics bodies (pink) of static objects and entities in the map. |
| Overlay physics debug | Displays physics debug + normal game meshes. |
| Draw Gui debug | Displays pink overlay which represents intractable GUI elements. |
| Show TV Safe Area | Shows the safe area of a TV, surrounded by red borders. |
| Show Missing Voice Error | Lists voice subjects which have missing voice files. |
| Resource Logging | Logs game resources. [Clarify] |
| Show non-preloaded resources | Lists resources which are not preloaded by the game. [Clarify] |
| Show Memory Usage | Shows information about the game memory usage:
Memory Usage: The amount of VRAM used by the renderer. This contains frame buffers, shadows, terrain and post-effects. It is greatly affected by the resolution of the window. Texture Memory Usage: The texture memory used by the level. This contains all the textures used for the materials of the objects. Texture memory is reduced by a lot with just a few changes in the config file. Vertex Memory Usage: The amount of VRAM used by meshes and decals. The imporant difference between Vertex and Texture memory is that Vertex memory can't be reduced by changing a setting. It takes up as much space on a good and a bad computer. Total Memory Usage: The sum of the above memory usage. |
| Show Rendering Info | Shows information about the game rendering:
Draw Calls - The number of objects rendered in the current scene. Rendered Triangles / Vertices - The total number of triangles and vertices rendered per frame. Queries - A special draw call used to check if an object is occluded. It is more expensive than a draw call. |
| Show Garbage Collection | Shows a graph of garbage collection. [Clarify] |
| Show Debug Info Window | Displays a window with debug information. [Clarify] |
| Hide Sleeping Entities | Makes sleeping entities invisible in the map. To do: Link to source about sleeping entities |
| Use Portal Culling | Enables the game to use portal culling in the map. It is recommended to always leave that on, unless you want to see the difference in performance. To do: add reference link for portals |
Additional Options
Brightness
The brightness slide increases / decreases the brightness of the game. Not to be confused with gamma.
Print Container Debug Info
This button prints container debug info to the screen.
|
Bug: The button makes the game crash. |
Merge Lang Files
Merges two language files between the main game language file and another.
Map
The map section of the menu includes settings and actions which are related to maps in general, as well as the currently-loaded map.
Auto Reload Resources
This makes the map reload resources (mostly game assets) automatically, should you change or add something to the mod.
Reload Script At Task Switch
The script file for the map will be updated when a task switch has been performed. Meaning, as long as you do not go back to the game after changing the script, the new script won't be updated in the game.
Reload Script Constantly
The script file for the map will be updated constantly every time it is saved. It doesn't matter if the game task is focused or not.
Recompile Script and Lang
Leftover feature from HPL2. The button does not work.
Reload from current pos
When reloading a map, the player will retain the current position instead of starting at the beginning of the map.
Fast Physics Load
Unknown option. [Clarify]
Reload Game
Reloads the map. This also resets the state of the player and all the other scripts which run in the background.
Script Debug
Script Debug enables further scripting features that won't work otherwise, such as OnAction. It is also useful to make your map behave differently. In your map script file, you may want to change the behavior of your map depends if the script debug is enabled or not. For example:
// This script will enable the player's flashlight only if the script debug is on.
void OnStart()
{
  if (cScript_ScriptDebugOn()) // Checks if Script Debug option is turned on or not
  {
     Player_SetFlashlightDisabled(false);
  }
}
Teleport to Start Pos
Teleports the player to a specific PlayerStart Area that can be selected from the dropdown list. Useful for skipping areas in a map.
Load Map
Select a map file to load in the game. HPL3 Map File (.hpm) and HPL2 Map File (.map) are accepted.
Test Change Map Save
Unknown option. [Clarify]
Preload Map
Loads another map in the background so it can be loaded later much faster. Main article: Level Streaming
Start Preloaded Map
Loads the pre-loaded map. If no map has been pre-loaded, the button will do nothing.
Keep Previous Map Loaded
Keeps the previous map loaded. This is useful if you want to go quickly switch between two maps.
Preload Priority
Sets the priority of the map preload process. Ranges from paused to very high
Game
The game section of the menu includes general-purposes option which affect how you play and move in the game. It also displays debug information such as scripting errors.
|
This article or section is a stub. You can help by adding to it. |
Input
The Input section of the menu includes tools and option for capturing and analyzing user input.
|
This article or section is a stub. You can help by adding to it. |
Stress Test
This is a tool used to test the map under heavy performance conditions.
|
This article or section is a stub. You can help by adding to it. |
Misc
The misc section include options which don't fit anywhere else.
|
This article or section is a stub. You can help by adding to it. |
Graphics Debug
Debugging the graphic performance of a level is vital to understand which parts are causing the bottleneck. It can also be used to find bugged/incorrect meshes or entities. With this section of the debug menu, you will be able to find which parts of the scene take up the most performance.
Show FPS Graph
This option displays on the screen a graph that shows FPS peaks on a time scale. It's useful for finding areas in a map that reduce FPS the most.
Large Light Test
Unknown option.
Previous Frame Occlusion
This option pauses the occlusion culling and renders the scene with the occlusion culling from before the checkbox was ticked. This is used to see how effective the occlusion culling is in the specific scene. After activating this you can switch to to spectator camera mode and look at the scene from another angle to see where the culling fails. Activating this will disable rendering of translucent objects since they can be unstable.
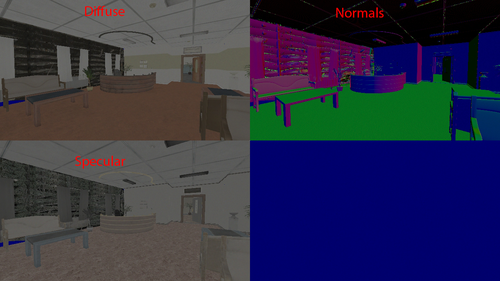
GBuffer
Shows what the frame buffers look like. These are then used by the lights to shade the scene. It can be used to check if a model has incorrect textures or normals.
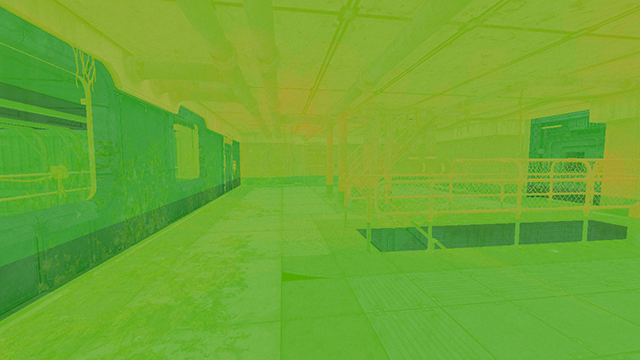
Light Complexity
Light complexity shows how expensive the lighting of a scene is. It creates a heat map on the screen to show how much power each light takes. Overdraw of light is not very expensive, it is about twice as expensive as a translucent object. When the light has a shadow map it becomes much more expensive. The complexity of a shadow casting light is based on how many draw calls and triangles are required to generate the shadow map.
Overdraw
Creates a heat map that shows how much translucent overdraw each pixel receives. Overdraw is how many times a pixel gets rendered to.[Clarify]
The goal should be that no part of the screen is red. It does not matter that much if only a small part is, however.


