Difference between revisions of "HPL2/AMFP/DebugBar"
(Upload from wiki) |
(Merged with dev env) |
||
| (3 intermediate revisions by the same user not shown) | |||
| Line 1: | Line 1: | ||
| − | = | + | {{stub}} |
| + | {{todo|Move this to a more appropriate name}} | ||
| + | ==Developer environment== | ||
| − | + | The dev set-up is the same as in TDD. You can read the tutorial [[HPL2/Development_Environment|here]]. | |
| − | + | However, there are some missing features. F1 still brings up the debug menu, but it doesn't contain some of the previously present features. Unfortunately, the game can't be sped up with F3 and the map can't be reloaded with F2 anymore. F8 still takes screenshots though. | |
| − | [ | + | == Debug Menu == |
| + | [[File:MFP-debug-bar.png|frame|right]] | ||
| + | Not all features are present, but there have been a few new ones added. | ||
| − | + | [[File:MFP-Gbuffer.png|thumb|left|Viewing G-Buffer contents in-game (Diffuse Colour, Z-Buffer and Surface Normal)]] | |
| − | + | The Chinese Room have added a couple of new debugging features, such as in-game dynamic prop placement to speed up the process of placing small objects accurately in the environment by doing so during run-time (image on the right). | |
| − | + | Another added feature is the ability to view the separated contents of the G-Buffer used during the process of color grading the game. | |
Latest revision as of 17:21, 4 August 2020
|
This article or section is a stub. You can help by adding to it. |
To do: Move this to a more appropriate name
Developer environment
The dev set-up is the same as in TDD. You can read the tutorial here.
However, there are some missing features. F1 still brings up the debug menu, but it doesn't contain some of the previously present features. Unfortunately, the game can't be sped up with F3 and the map can't be reloaded with F2 anymore. F8 still takes screenshots though.
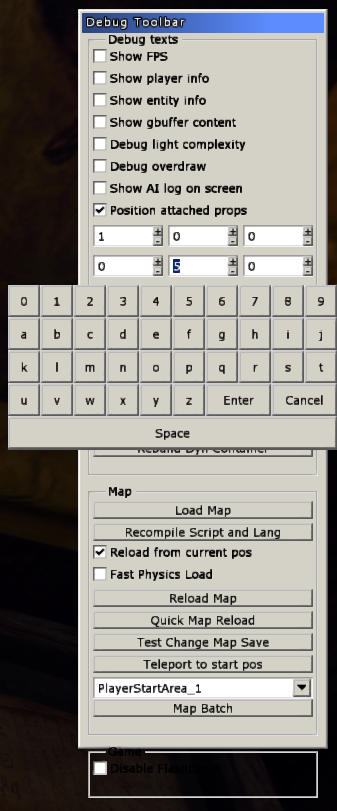
Debug Menu
Not all features are present, but there have been a few new ones added.
The Chinese Room have added a couple of new debugging features, such as in-game dynamic prop placement to speed up the process of placing small objects accurately in the environment by doing so during run-time (image on the right).
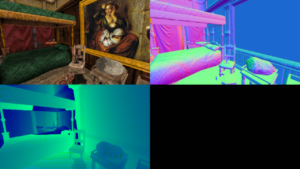
Another added feature is the ability to view the separated contents of the G-Buffer used during the process of color grading the game.

