Difference between revisions of "HPL2/AMFP/DebugBar"
Jump to navigation
Jump to search
m (Moderation) |
|||
| Line 1: | Line 1: | ||
| − | |||
| − | |||
{{stub}} | {{stub}} | ||
= Debugging Toolbar = | = Debugging Toolbar = | ||
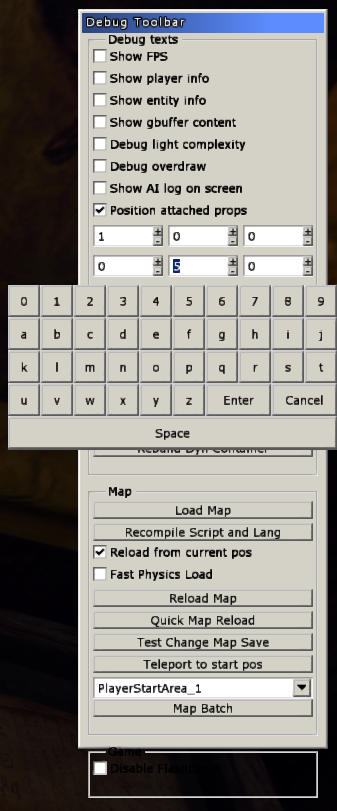
| + | [[File:MFP-debug-bar.png|frame|right]] | ||
| + | The debugging toolbar is accessible [[HPL2/Development_Environment|with the same process as in TDD]]. Not all features are present, but there have been a few new ones added. | ||
| − | + | [[File:MFP-Gbuffer.png|thumb|left|Viewing G-Buffer contents in-game (Diffuse Colour, Z-Buffer and Surface Normal)]] | |
| − | |||
| − | |||
| − | |||
| − | [ | ||
| − | |||
| − | |||
| − | + | The Chinese Room have added a couple of new debugging features, such as in-game dynamic prop placement to speed up the process of placing small objects accurately in the environment by doing so during run-time (image on the right). | |
| − | + | Another added feature is the ability to view the separated contents of the G-Buffer used during the process of color grading the game. | |
Revision as of 23:22, 22 July 2020
|
This article or section is a stub. You can help by adding to it. |
Debugging Toolbar

The debugging toolbar is accessible with the same process as in TDD. Not all features are present, but there have been a few new ones added.

The Chinese Room have added a couple of new debugging features, such as in-game dynamic prop placement to speed up the process of placing small objects accurately in the environment by doing so during run-time (image on the right).
Another added feature is the ability to view the separated contents of the G-Buffer used during the process of color grading the game.