Developer Debug Menu
|
This article is actively undergoing a major edit. The user who added this notice will be listed in its edit history should you wish to contact them. |
When developing your mod, it is important to be able to have a fast feedback loop and have extensive set of tools which can help to test our mod. Exactly for that reason, we have the Developer Menu. This article goes in detail over the menu and all of its features.
Contents
Keyboard Shortcuts
The following keyboard shortcuts are enabled during dev mode:
| Shortcut Key | Action |
|---|---|
| F1 | Brings up the developer debug menu. This needs to be done in order to have full access to the developer features when running a game in debug mode. |
| F2 | Pauses / Resumes the game world processes, basically makes the game freeze. Note that you can still noclip in this state. |
| F3 | This makes the game run 4 times faster. It is good if you want to skip specific sections in the map. |
| F4 | This makes the game run 4 times slower. It is goof if you want to want to focus on something that happens very fast in the map. |
| F5 | Reloads the current map. |
| F7 | Enables / Disables spectator camera mode (noclip). |
| F8 | Takes a screenshot of the game and saves it inside the main game folder. |
| F9 | Quick-saves the game. |
| F10 | Quick-loads the last save. |
| Insert | Starts / Stops quick input recording and saves to the file QuickRecord.sav. |
| Home | Starts playing back the last quick input recorded file. |
Debug Menu
The debug menu is where most of the work happens. There, you can find a list of useful actions which will help you in your mod development. This is how it should look after bringing it up (F1)
Debug Texts
This section is at the very top of the menu and consists of checkboxes which display different information about the game, map, physics, script, etc on in the form of text on the screen.
| Option | Description |
|---|---|
| Show FPS | Shows the game FPS. |
| Show module info | Shows information about different user modules. It does not seem to be useful however, as not enough information is displayed. |
| Show map info | Shows the amount of entities in the map and their state. |
| Show entity info | Does not work. |
| Show sounds playing | Shows a list of all the sounds that currently play in the map, and information about them. |
| Show sound params | Adds additional information to the sounds playing list (distance from player) |
| Show sound categories | Shows a list of all the different sound level categories. |
| Show sound ai event | Shows a message when an Ai agent has heard a sound. |
| Show debug messages | Shows dev messages which are specified in the map script file. |
| Show event/voice messages | Does not work. |
| Inspection Mode | Enables inspection mode, which displays information about assets used in the map, such as texture files, location on disk, size, etc. |
| Occlusion Culling | Enables occlusion culling (Skips rendering polygons that are no in the view of the player ). |
| God Mode | Makes the player invincible and prevents from getting chased by enemies. |
| Draw physics debug | Displays physics bodies (pink) of static objects and entities in the map. |
| Overlay physics debug | Displays physics debug + normal game meshes. |
| Draw Gui debug | Displays pink overlay which represents intractable GUI elements. |
| Show TV Safe Area | Shows the safe area of a TV, surrounded by red borders. |
| Show Missing Voice Error | Lists voice subjects which have missing voice files. |
| Resource Logging | Logs game resources. [Clarify] |
| Show non-preloaded resources | Lists resources which are not preloaded by the game. [Clarify] |
| Show Memory Usage | Shows information about the game memory usage:
Memory Usage: The amount of VRAM used by the renderer. This contains frame buffers, shadows, terrain and post-effects. It is greatly affected by the resolution of the window. Texture Memory Usage: The texture memory used by the level. This contains all the textures used for the materials of the objects. Texture memory is reduced by a lot with just a few changes in the config file. Vertex Memory Usage: The amount of VRAM used by meshes and decals. The imporant difference between Vertex and Texture memory is that Vertex memory can't be reduced by changing a setting. It takes up as much space on a good and a bad computer. Total Memory Usage: The sum of the above memory usage. |
| Show Rendering Info | Shows information about the game rendering:
Draw Calls - The number of objects rendered in the current scene. Rendered Triangles / Vertices - The total number of triangles and vertices rendered per frame. Queries - A special draw call used to check if an object is occluded. It is more expensive than a draw call. |
| Show Garbage Collection | Shows a graph of garbage collection. [Clarify] |
| Show Debug Info Window | Displays a window with debug information. [Clarify] |
| Hide Sleeping Entities | Makes sleeping entities invisible in the map. To do: Link to source about sleeping entities |
| Use Portal Culling | Enables the game to use portal culling in the map. It is recommended to always leave that on, unless you want to see the difference in performance. To do: add reference link for portals |
Show FPS
Shows how fast the level is running.
FrameTime: Shows how long it takes to render a frame, this is the most important info. FPS: 1000 / FrameTime. It is what you usually see when talking about performance. It is easier to grasp but not as useful as FrameTime.
Show Memory Usage
Renderer Memory Usage: The amount of VRAM used by the renderer. This contains frame buffers, shadows, terrain and post-effects. It is greatly affected by the resolution of the window. Texture Memory Usage: The texture memory used by the level. This contains all the textures used for the materials of the objects. Texture memory is reduced by a lot with just a few changes in the config file. Vertex Memory Usage: The amount of VRAM used by meshes and decals. The imporant difference between Vertex and Texture memory is that Vertex memory can't be reduced by changing a setting. It takes up as much space on a good and a bad computer. Total Memory Usage: The sum of the above memory usage.
Show Rendering Info
Draw Calls: The number of objects rendered in the current scene. Rendered Triangles / Vertices: The total number of triangles and vertices rendered per frame. Queries: A special draw call used to check if an object is occluded. It is more expensive than a draw call.
Graphics Debug
Debugging the graphic performance of a level is vital to understand which parts are causing the bottleneck. It can also be used to find bugged/incorrect meshes or entities. Start Depth.exe in Dev mode and then press F1 to bring up the Debug Toolbar. The two groups that are important are the "Debug texts" and "Graphics Debug".
Graphics Debug
To be able to find which parts of the scene that takes up the most performance you can use these special render modes.
Previous Frame Occlusion
Pauses the occlusion culling and renders the scene with the occlusion culling from before the checkbox was ticked. This is used to see how effective the occlusion culling is in the specific scene. After activating this you can press F7 to fly around and look at the scene from another angle to see where the culling fails. Activating this will disable rendering of translucent objects since they can be unstable.
In the image to the left you can see what the player can see. It looks like only a few walls, some lockers and a door is rendered. On the right the camera has been moved back and it is now possible to see all the objects that get rendered this frame. There are a lot more than what it looks like in the left picture.
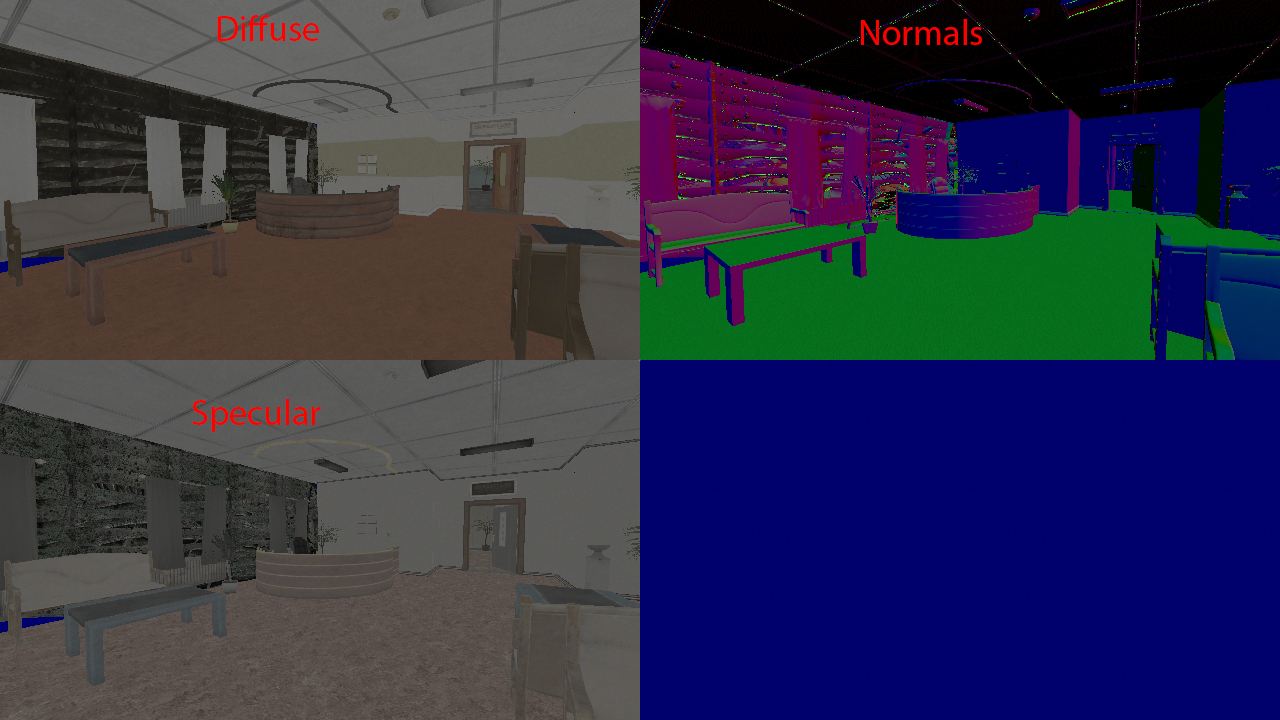
GBuffer
Shows what the frame buffers look like. These are then used by the lights to shade the scene. It can be used to check if a model has incorrect textures or normals.
Light Complexity
Light complexity shows how expensive the lighting of a scene is. It creates a heatmap on the screen to show how much power each light takes. Overdraw of light is not very expensive, it is about twice as expensive as a translucent object. When the light has a shadow map it becomes much more expensive. The complexity of a shadow casting light is based on how many draw calls and triangles are required to generate the shadow map.
The red areas on the right image is not good. There seem to be multiple large (in screen space) shadow casting lights in this scene.
To test if most of the complexity comes from shadows you can toggle the "Draw Shadows" checkbox on the Debug Menu. Here is what the scene complexity looks like without shadows.
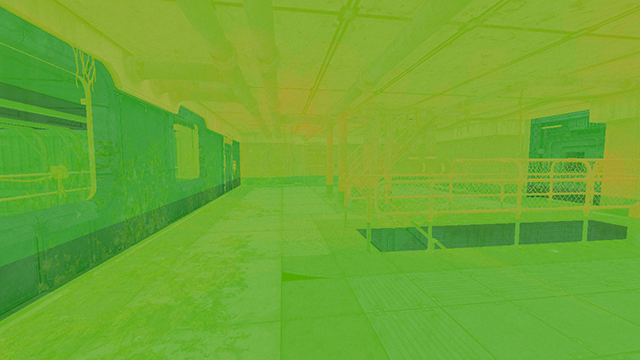
Overdraw
Creates a heatmap that shows how much translucent overdraw each pixel receives. Overdraw is how many times a pixel gets rendered to. The goal should be that no part of the screen is red. It does not matter that much if only a small part is.
Green: 0-16
Yellow: 16-32
Red: 32-48+
On the left you can see the scene rendered normally. The fog particles are barely visible here. On the right the pixel overdraw is rendered. The red areas show that more than 32 translucent planes are rendered, which is not good.


